In my last article, I wrote about the biggest blockers to AI adoption in strategic finance. In this piece I want to dig deeper into one of the hardest problems to solve: messy finance data.
Poor data is one of the most commonly cited reasons for the lack of AI adoption in finance. I've heard "garbage-in, garbage-out" from partners at the world's biggest PE funds, from CFOs of multi-billion-dollar companies, and from finance analysts working in spreadsheets every day. I think the saying is popular for three reasons.
First, every company in the world has messy data, so saying "our data is messy" is almost a truism. On its own, it tells you very little about your company or about what is actually stopping you from using AI. If you think your data is a mess, your peers probably have it just as bad or worse, and if you think it is perfectly clean, you may be judging it by pre-AI standards. Data can be good enough to close the books and still be missing much of what an AI agent needs to make a useful decision.
Second, "our data is too messy" is incredibly intuitive, since an AI agent can't make a good decision if we don't give it the information it needs to make one.
Third, "our data is too messy" is a convenient way to offload the failure to adopt AI onto external factors. It's not my fault we aren't adopting AI in finance; it's the fault of the legacy ERP, the data team, the data warehouse migration, or whatever else is on the list.
I want to unpack how to build a data foundation for AI, and why building one is so hard.
Let's first settle why a strong finance data foundation for AI matters. In short, poor data really limits what your finance function can do with LLMs. An agent helping with pricing needs to understand cost-to-serve, and an agent helping allocate growth capital needs to know which customers are profitable. The quality of those decisions depends on the data available to make them.
Next, we need a North Star, a definition of what a great data foundation for AI means. The data needs to be:
- Correct and complete, which agreed definitions and traceable sources usually solve.
- Available when the decision is made, which is hard, especially as finance data always arrives notoriously late.
- Available at the grain the decisions are made on, which usually requires attributing cost and revenue down to the grain that matters for your business: customer, project, order, transaction, and so on.
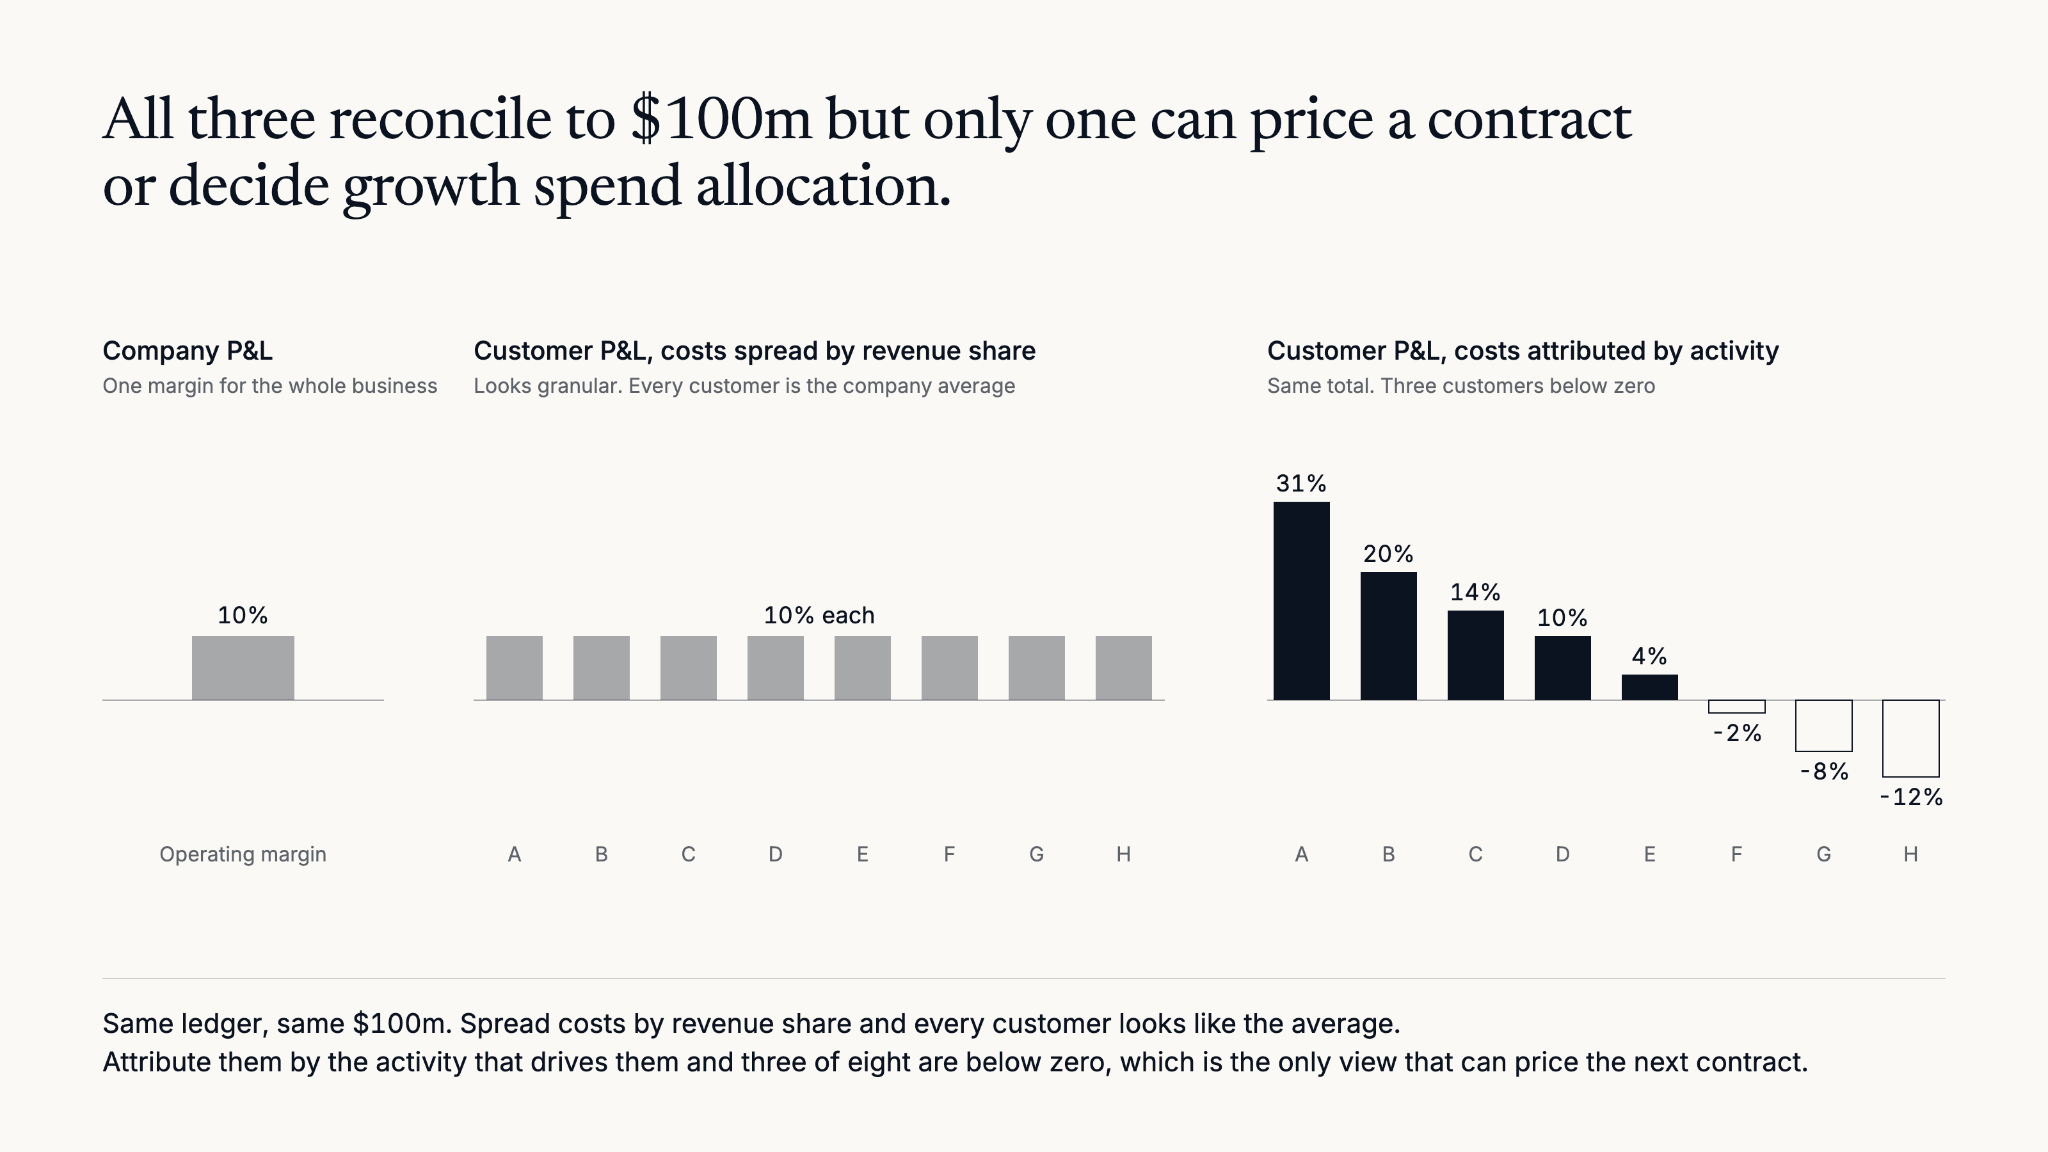
Together, these three give agents the inputs to support your most important pricing, growth, and operational decisions. Before you quote, an agent can forecast the cost of serving that specific customer and show which prices would meet your margin target. It can compare acquisition channels on expected customer profitability after acquisition and servicing costs, so you can decide where to increase or cut growth spend.
It can monitor expected project margins as the work happens and flag overruns while there is still time to act, and it can automate repetitive finance tasks. Get this right and finance teams spend less time wrangling data and more time acting on the findings, with numbers they can trace back to source. Ultimately, the goal is to make finance the function that makes sure every decision in your business is profit-justified.
How to build a finance data foundation for your business?
1. Use your key decisions to define the target grain and timing of your data
Start by identifying the finance decisions with the biggest impact on your business. For each one, ask what you need to understand to make it well, at what level of detail, and when that information could still change the outcome.
Take a manufacturer selling a similar set of products across different customer projects. Finance can improve decisions throughout the customer relationship, from the first bid through delivery and renewal, and each of those decisions needs a particular view of the economics.
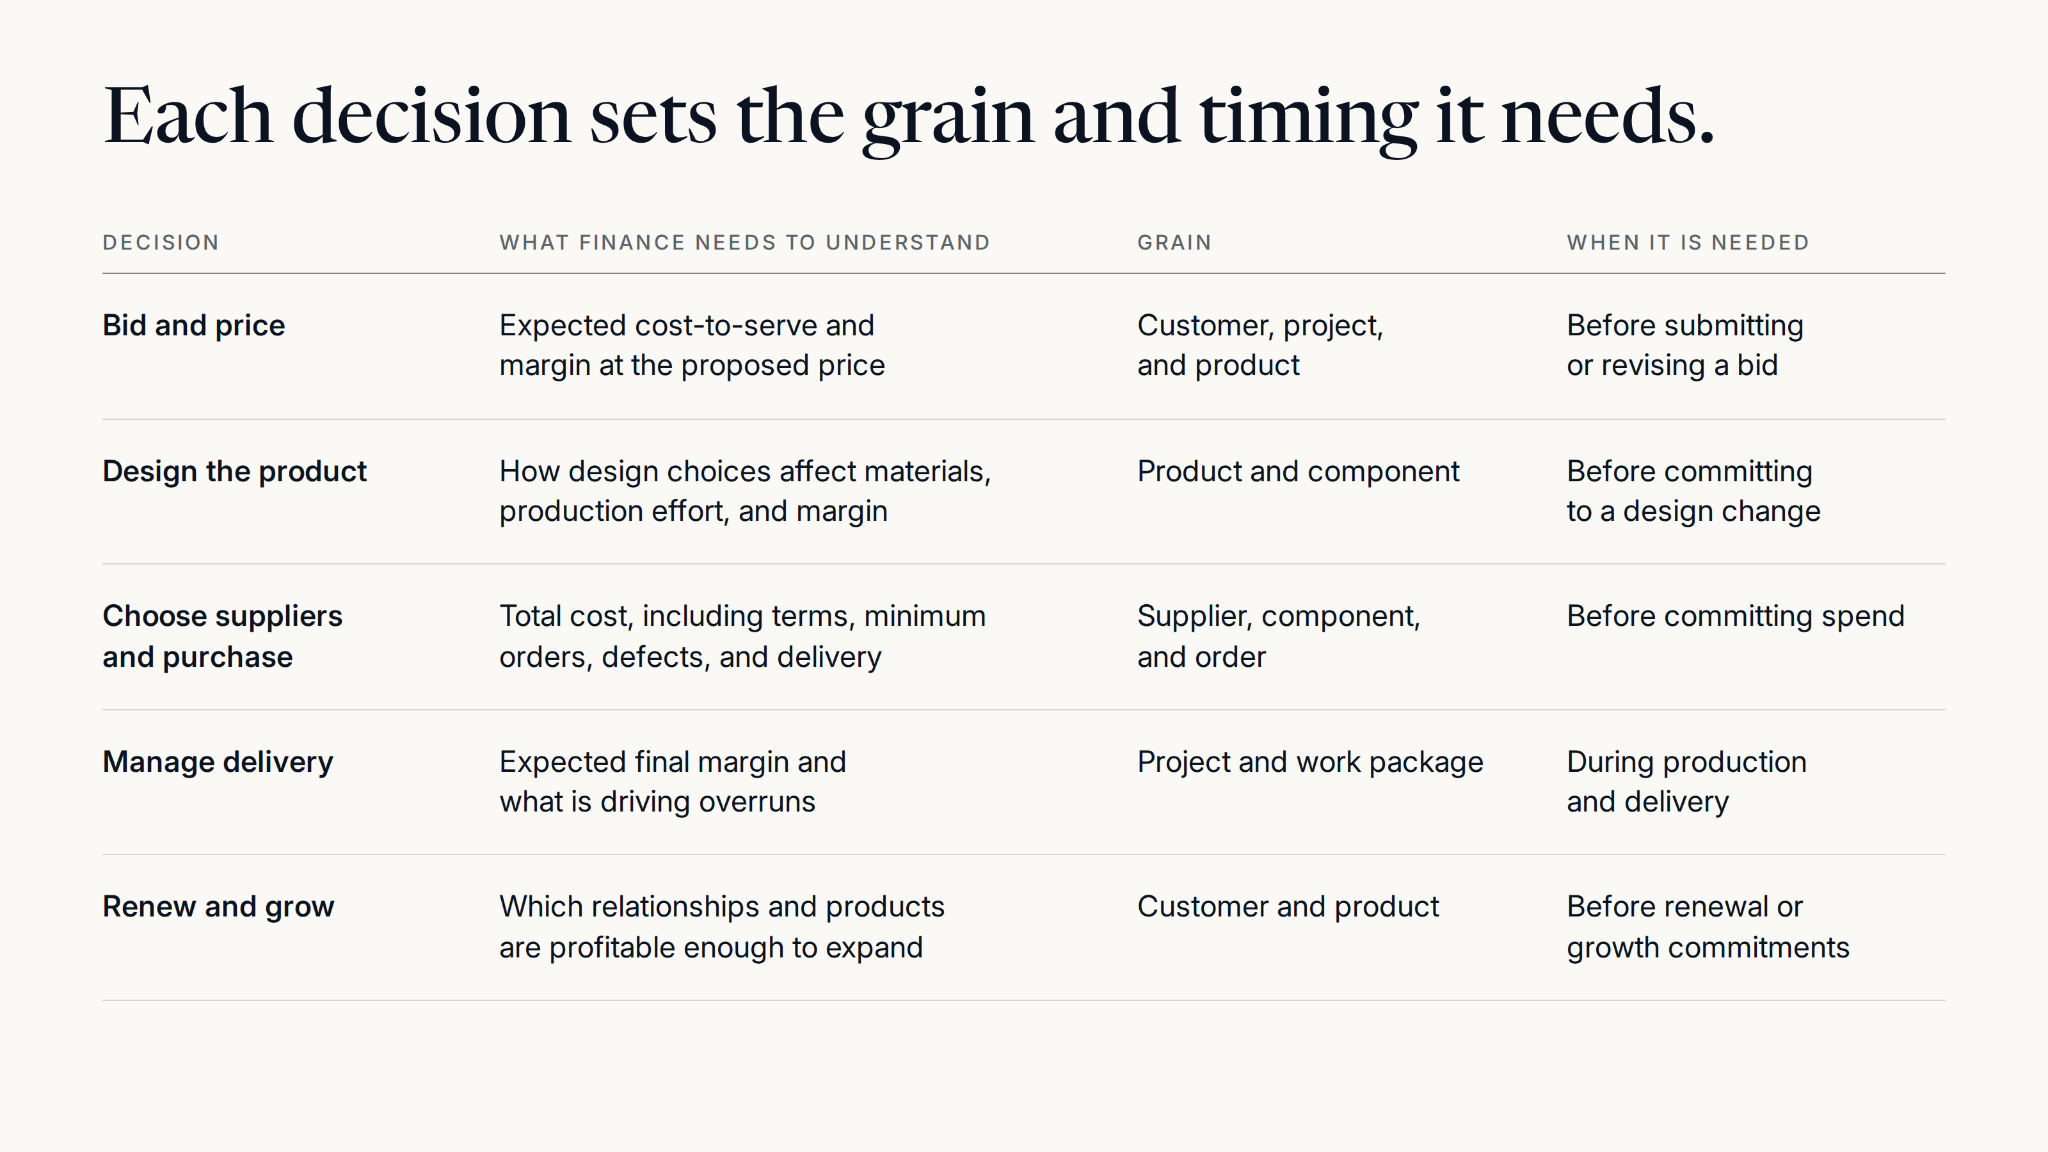
These decisions tell you what the finance data foundation needs to contain. To evaluate a product redesign, you need to know how changing a component affects the cost of that product. To price a customer contract, you need to combine those product costs with the engineering, support, and delivery work that particular customer will require. The same underlying costs need to be connected to the different decisions they inform.
The decision also determines how current the data needs to be and where you need forecasts. Before bidding, most of the costs are still ahead of you, whereas during delivery you need actual costs to date alongside a forecast of the remaining work. A final margin calculated after the project ends arrives too late to help you correct an overrun.
The output of this exercise is a concrete set of requirements: the financial views you need, the detail each must contain, and when each must be available. Those requirements tell you which financial and operational data to connect, what attribution logic to build, and which forecasts to maintain.
The same exercise looks different in other industries: a financial services business might need profitability by customer, loan, or transaction to price a product or allocate growth spend. A logistics business might need margin by shipment, route, and customer to price a contract and decide which work to take. Start with the decisions in your business and work backwards to the grain and timing they require.
2. Go through your PnL and identify the data you need
Now ask what data would let you make those decisions well, and where it lives.
A strong foundation brings financial and operational data together. An invoice tells you what you owe, but it often does not tell you what drove the cost. The bill for quality assurance engineers does not tell you how much time they spent checking each product, and a fuel invoice does not tell you which deliveries consumed the fuel.
For the manufacturer, the operational records include bills of materials, production records, engineering and quality assurance hours, and shipments. Go through the P&L line by line and identify the financial source, the activity that explains it, and the grain it needs to reach.
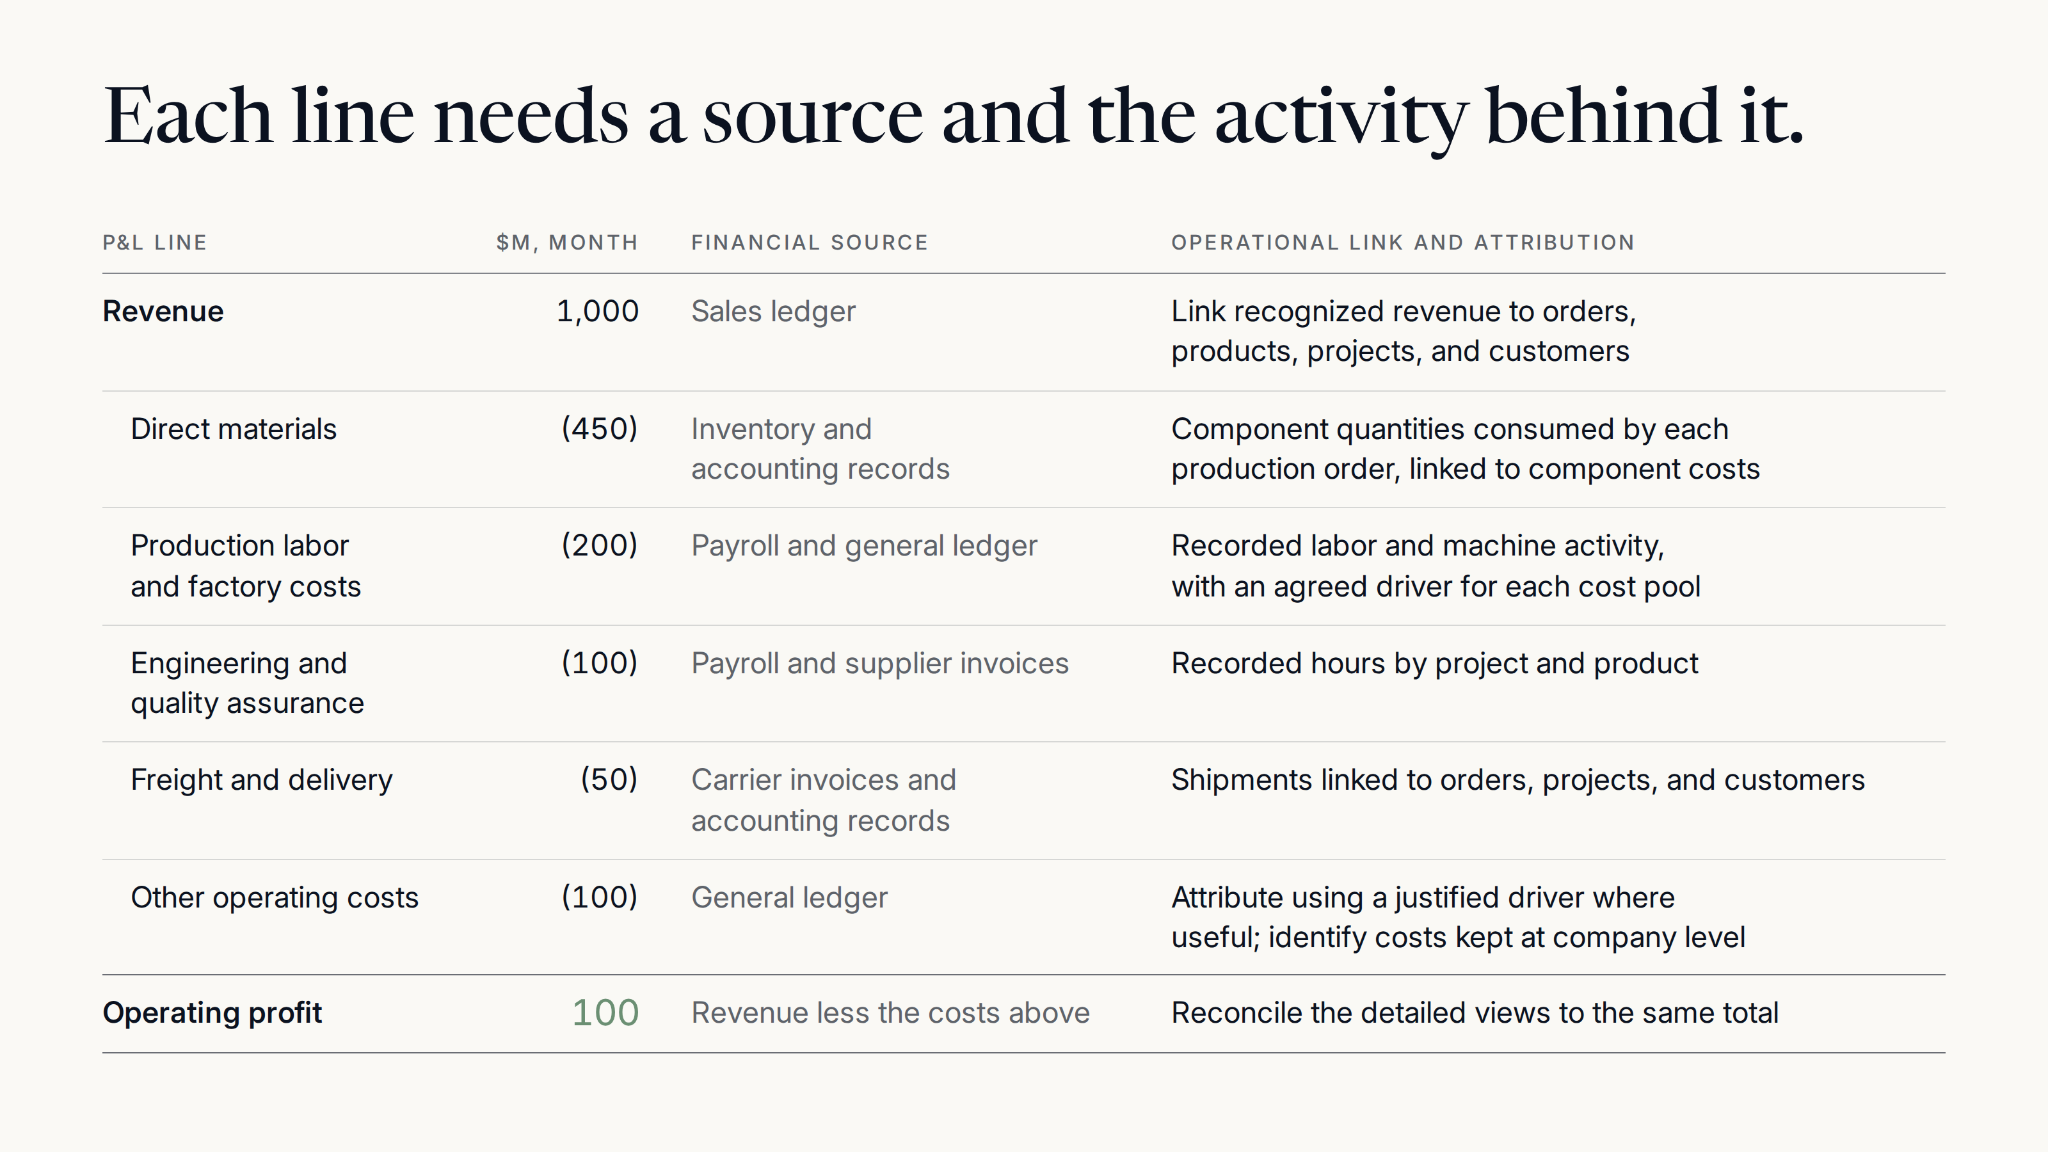
The output is a concrete list of sources to connect and rules to build. Customer, product, and project margins are different views of the same economics, so switching between them should never count a cost twice.
3. Connect the data and build attribution rules that stay current
For each P&L line, define how the cost reaches the customer, project, or product it belongs to, and decide what happens when some of the information is still missing.
Take the engineering and quality assurance line above. The costs come from payroll and supplier invoices, and the activity that explains them is the team's recorded hours, with each time entry linked to a project. Once finance has agreed that recorded hours are the driver, the allocation follows from the data rather than from anyone's judgment, and because every project belongs to a customer, the same rule gives you a customer view of the cost without a second calculation.
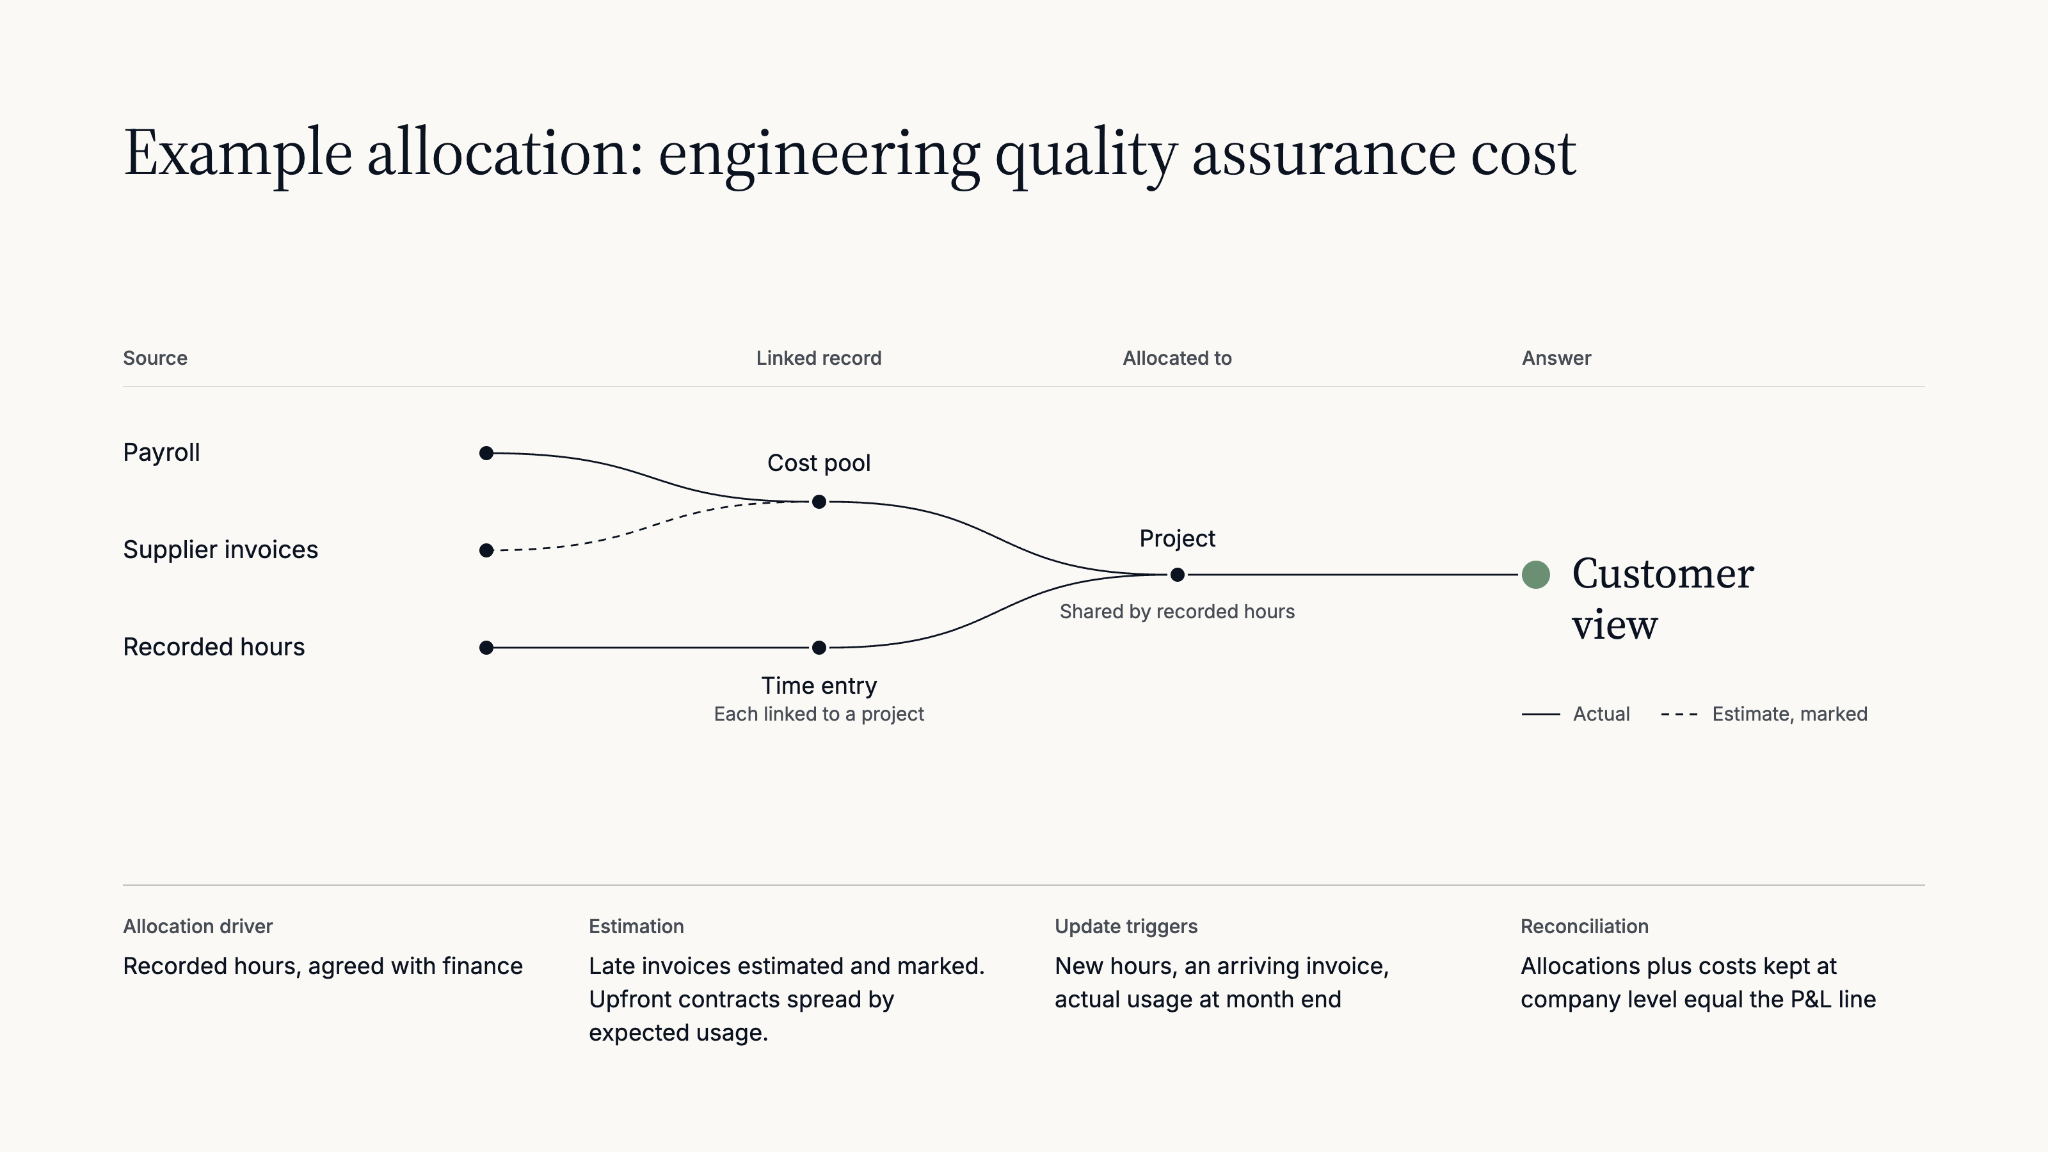
The harder part is timing. A project's margin is most useful before the month has closed, while there is still time to act on it, and at that point some supplier invoices have not arrived. Rather than leave the cost out, you estimate it from what is already known and let the project carry that estimate, clearly marked, until the invoice arrives and takes its place. Handled this way, a late invoice changes a number you can explain instead of a number you have to rebuild.
The rule also has to work in the other direction, when the money moves before the activity it pays for. A maintenance contract paid upfront belongs to every month it covers, and within each month to the projects that used the service, which you only know for certain once the month is over. The model starts from the usage you expect and corrects itself as actual usage comes in, so the early months settle while the later ones are still estimates.
For each cost pool, write down the sources, the links between records, the allocation driver, the estimation method, and what triggers an update. Then check that the allocations, together with any costs deliberately kept at company level, reconcile to the total.
The result is a maintained calculation: new activity updates the allocation, invoices replace estimates, and finance can trace both the current number and why it changed.
4. Have a process for updating the logic
When a supplier changes its prices, a product gets redesigned, or a new team starts supporting a project, those changes need to flow into the allocation rules and models.
Give each rule an owner and a clear process for updating it, one that records what changed and when it takes effect, checks the impact on the numbers, and refreshes the affected views. The foundation needs to keep working as the business changes.
5. Build the core forecasts your decisions depend on
Estimating costs that have already been incurred keeps today's view current, but you also need forecasts for decisions about what happens next.
For the manufacturer, bidding needs a cost-to-serve forecast for the proposed customer and order, a model that might combine expected component quantities and prices, production and engineering effort, delivery costs, and contract terms. Revenue forecasts help plan capacity, and commodity-price assumptions and scenarios feed into the cost models where the business is exposed to those prices. A financial services business might need a shared set of interest-rate forecasts and scenarios instead.
Build a core set of these forecasts, give them owners, and agree how they are updated. Finance analysts and AI agents should be able to use the same current assumptions, with room to test the scenarios relevant to a particular decision.
Otherwise, everyone builds a new forecast each time they need to make a decision, and let's be honest, not all of them are going to take the time to build it well. You end up with different answers because people are making different guesses about the same business.
That is the work: start with the decisions, connect and attribute the right data, keep the logic current, and build the forecasts those decisions need. The hard part is doing it well.
What makes it difficult to build a good finance data foundation?
The steps above give you a process to follow; the difficulty is making those rules work with the data your company actually has, and keeping them working as the business changes.
Most companies we talk to have a version of the same story: the revenue side of the P&L is in reasonable shape, and the cost side is a mess.
This is no coincidence. Revenue data is usually generated by your own systems, so an order, subscription, or transaction is recorded in a format you control. Much of your cost data arrives from other companies, through invoices, contracts, and statements, on their schedule and with whatever fields they decided to include.
Turning those records into a live finance data foundation takes a lot of interpretation.
The records do not contain all the context you need
Some systems are hard to extract data from, and vendor reports arrive in different formats. But even after you have collected everything and organized it into clean tables, you still need to understand what it means.
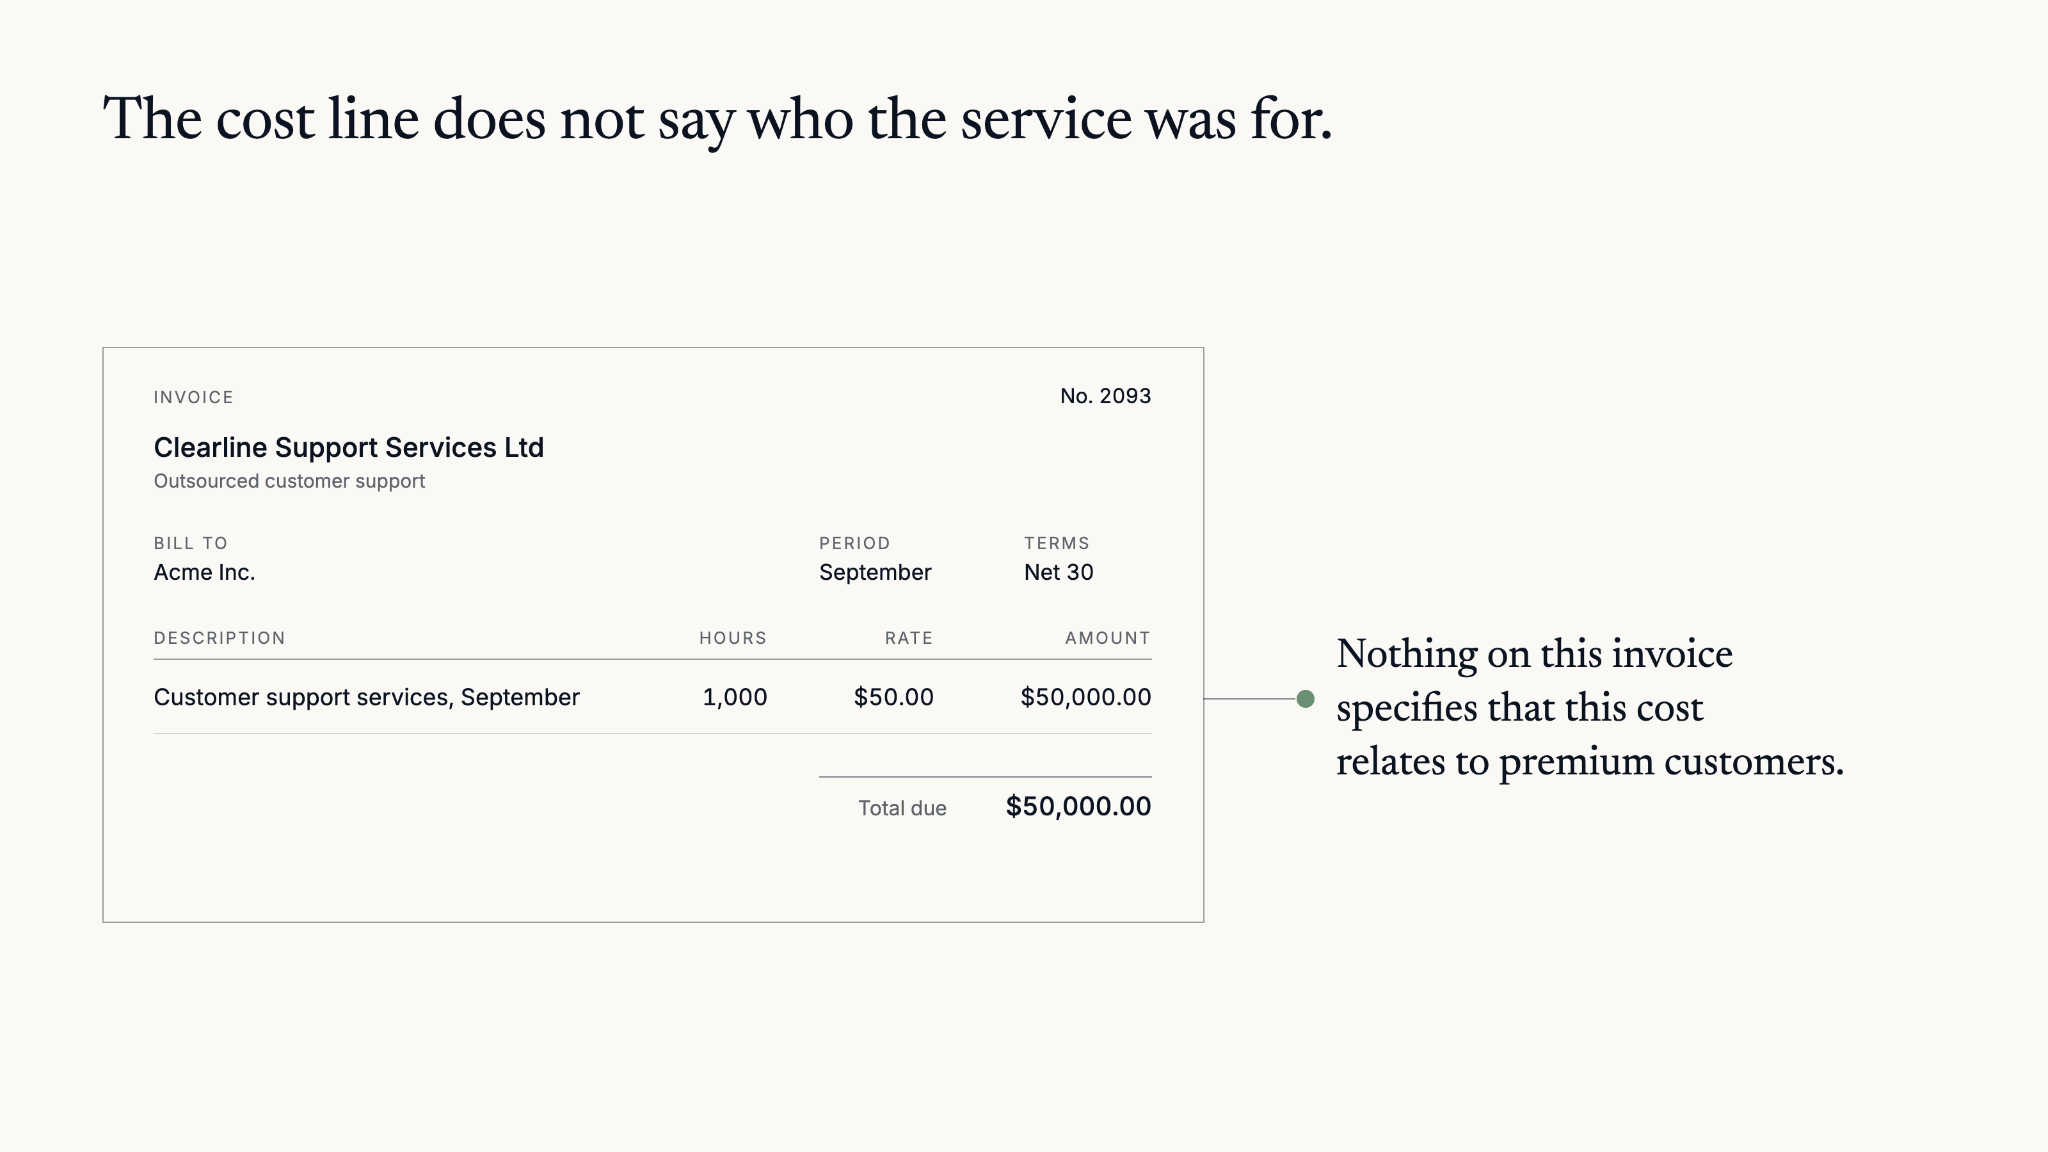
Take customer support costs. Allocating them might require knowing which work relates to premium users and which relates to all customers. That information usually will not be captured in an invoice and will require additional context.
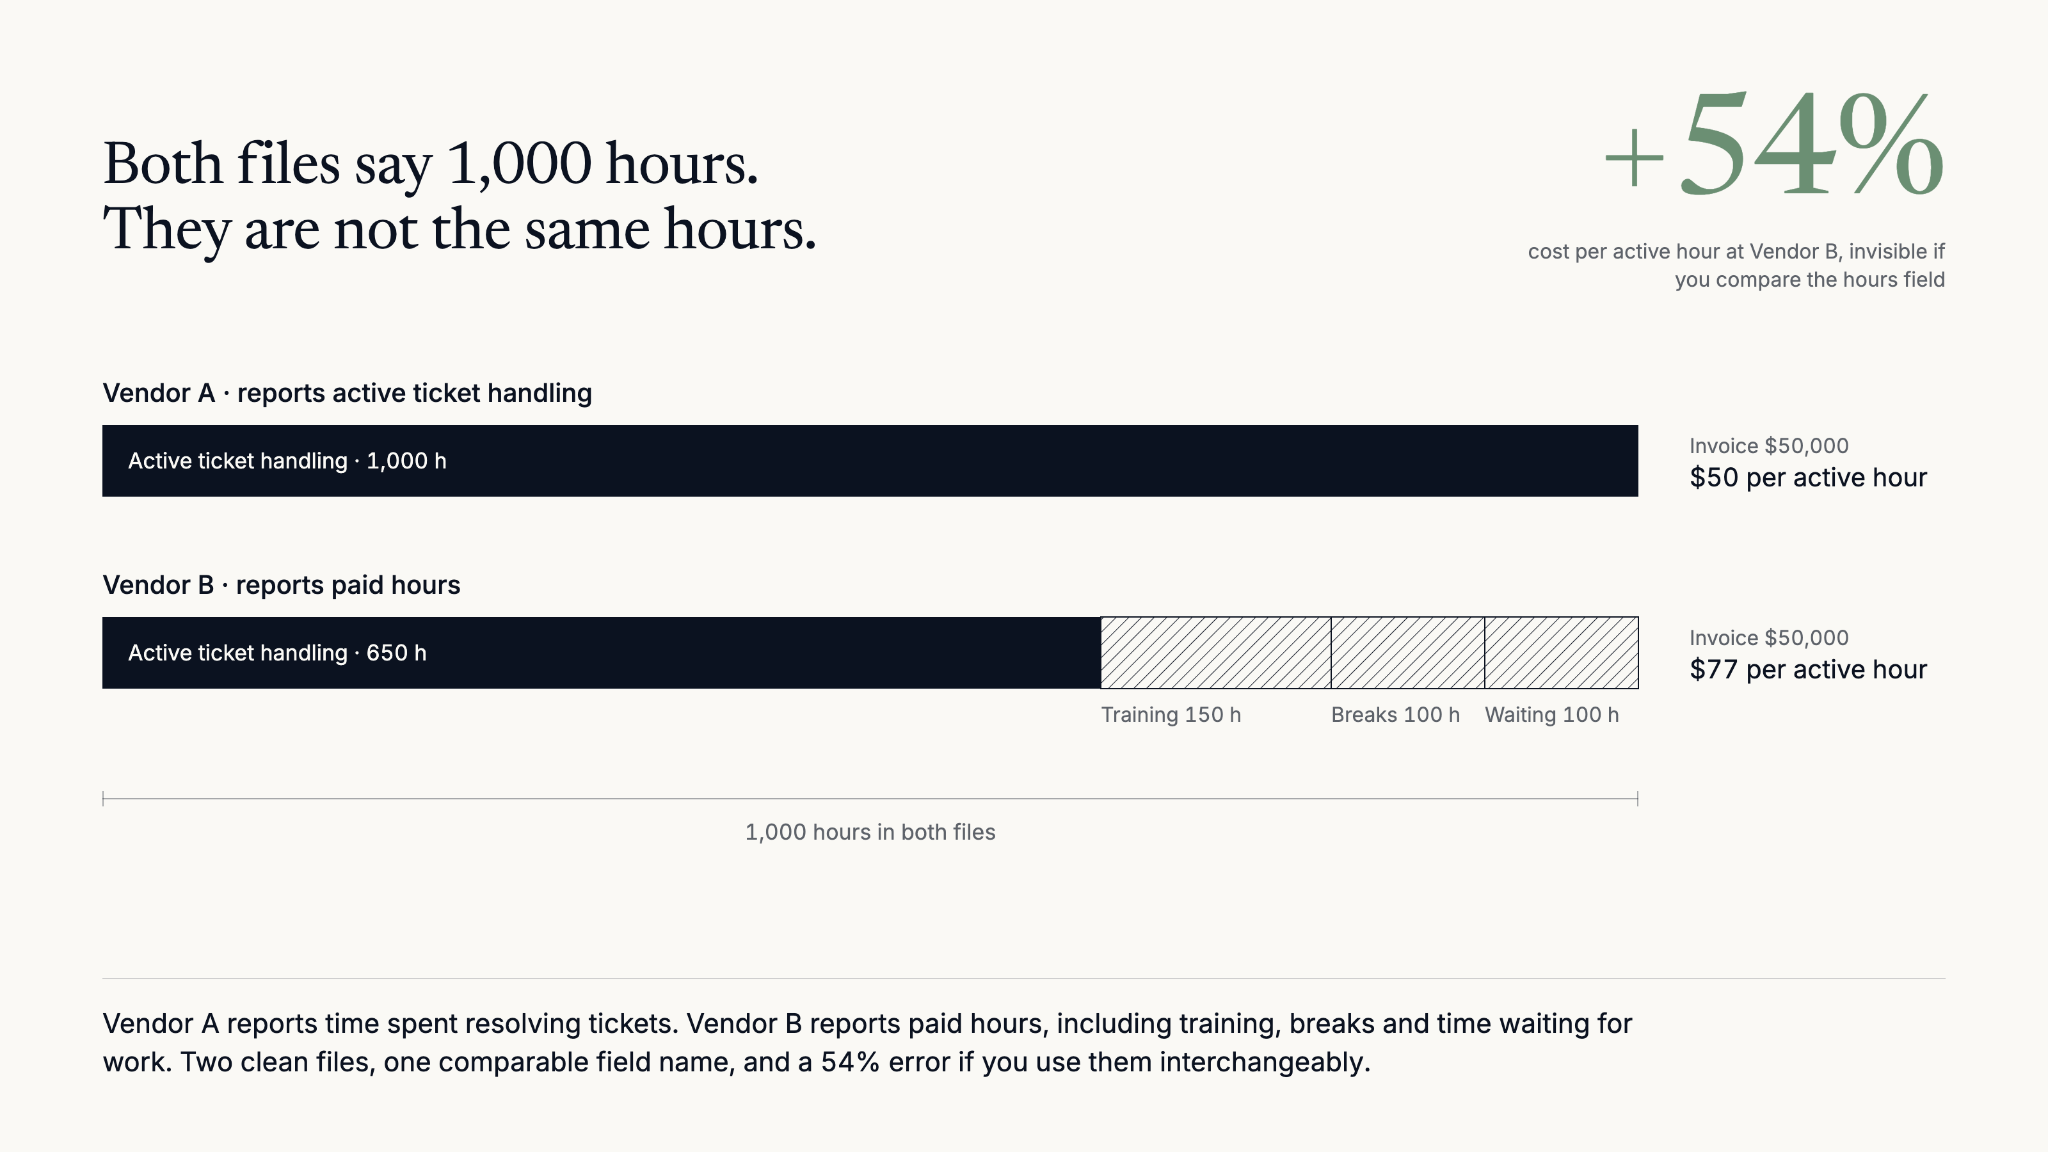
The problem also appears when fields look comparable but mean different things. Take two outsourced customer support providers, or BPOs, that both report "hours." One reports time actively spent resolving tickets, while the other reports total paid hours, including training, breaks, and time waiting for work.
Both files can be perfectly clean, and using those hours interchangeably to allocate costs or compare efficiency can still produce misleading results. You need to understand each vendor's definition, establish a comparable basis, and decide how to treat paid time outside active ticket handling. If the available records do not support a precise allocation, you need an explicit proxy.
That context lives across the business and keeps changing
Finance holds some of the context because it sees across the business. But procurement may know how a vendor charges, operations may know which customers use the service, and a regional manager may know that a particular cost applies only to the Spanish market.
The person building the model rarely has all of that knowledge; some of it is documented, and some lives in conversations, spreadsheets, or people's heads.
Collecting it is a coordination exercise: you need to find the right person, understand the process, agree how it should be represented, and check that the resulting numbers make sense.
Then something changes: a vendor introduces a new pricing model, a product launches, or the company changes its allocation methodology or enters another market. The context and the model need to be updated together.
As the company adds vendors, products, systems, and markets, there are more relationships and exceptions to maintain. Each may be manageable on its own, but together they add up to a substantial ongoing workload.
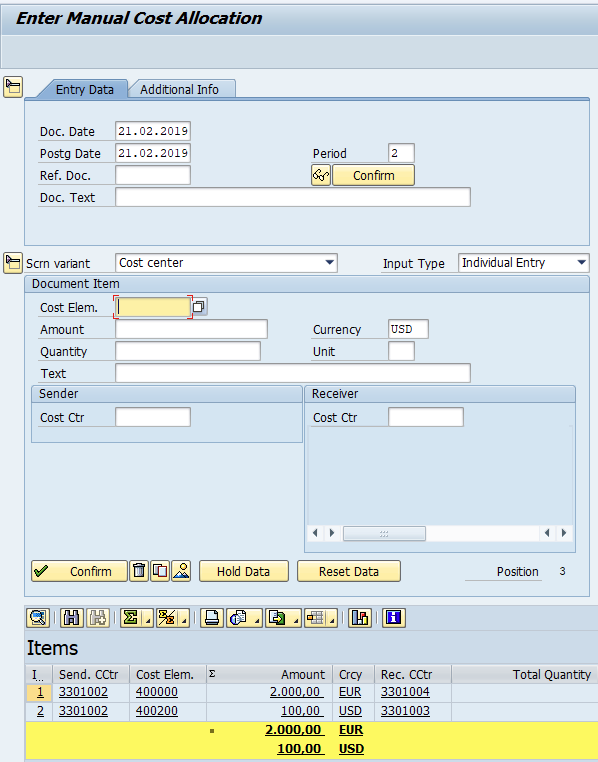
The tools do not take this work off your hands. An ERP, or a modeling layer like dbt on top of a warehouse, only runs logic that someone has already stated precisely, such as allocating a cost pool by recorded machine hours. It has nowhere to put the judgment behind the rule, that one vendor's hours include idle time, or that a charge covers only the premium customers the invoice never names.
Everything the rules do not cover goes to a person, and in a company of any size that is a long tail of exceptions arriving every month. This is what stops the data foundation from being live. New records are attributed only when someone gets to them, so the numbers are only as current as that person's backlog. That is why an ERP comes with controllers and costing engineers around it, a dbt project comes with data engineers maintaining the mapping tables, and both come with spreadsheets alongside them.
What has changed is that an LLM can now hold the judgment neither tool could. You state your reasoning once, and it applies that reasoning to every record that follows
It is all data work, and there is never enough internal capacity to get it done
Strip away the industry specifics and the work at every one of these companies is the same job. Connecting engineering hours to projects at a manufacturer, matching fuel invoices to deliveries at a logistics business, attributing costs to individual transactions at a fintech: each one means extracting data from systems, turning it into a model of how the business actually operates, and keeping that model current as new records arrive.
Across industries, the sophistication and data sources vary, but the nature of the work does not. It is ETL, modeling, and maintenance, whether it runs in a warehouse, an ERP configuration, or a spreadsheet.
That is a problem, because data work is the scarcest resource in almost every company. In every business I have seen, at every size, there is always ten times more demand for it than supply. At a digital business, the data engineers finance needs are already supporting product and marketing. At a manufacturer, the ERP specialists, controllers, and costing engineers are maintaining systems, closing the books, and answering urgent requests.
At a logistics company, the operations analysts who hold the shipment and route data have their own backlog. Finance needs the output, but it controls neither the technical capacity nor the operational expertise required to produce it, so it queues behind everyone else.
So most of the work does not get done, not because anyone decided the decision was unimportant, but because it lost the fight for capacity against everything else the same people are responsible for. The important questions get a one-off project when they become urgent enough, and the rest get answered with averages, or not at all.
Finance cannot own a model it cannot explain, check, or change
Some companies get the connections and models running, only to hit another problem: finance cannot easily explain the numbers.
The allocation logic might sit in code, ERP configuration, or a complicated reporting model. The dashboard looks clean, but the people making decisions cannot see why a particular cost landed on a particular customer or project.
Sometimes the numbers do not reconcile with accounting: a cost might be missing, or the model might be using estimates, a different period, or a different scope. Some of those differences are expected and others are errors, and finance needs to tell them apart.
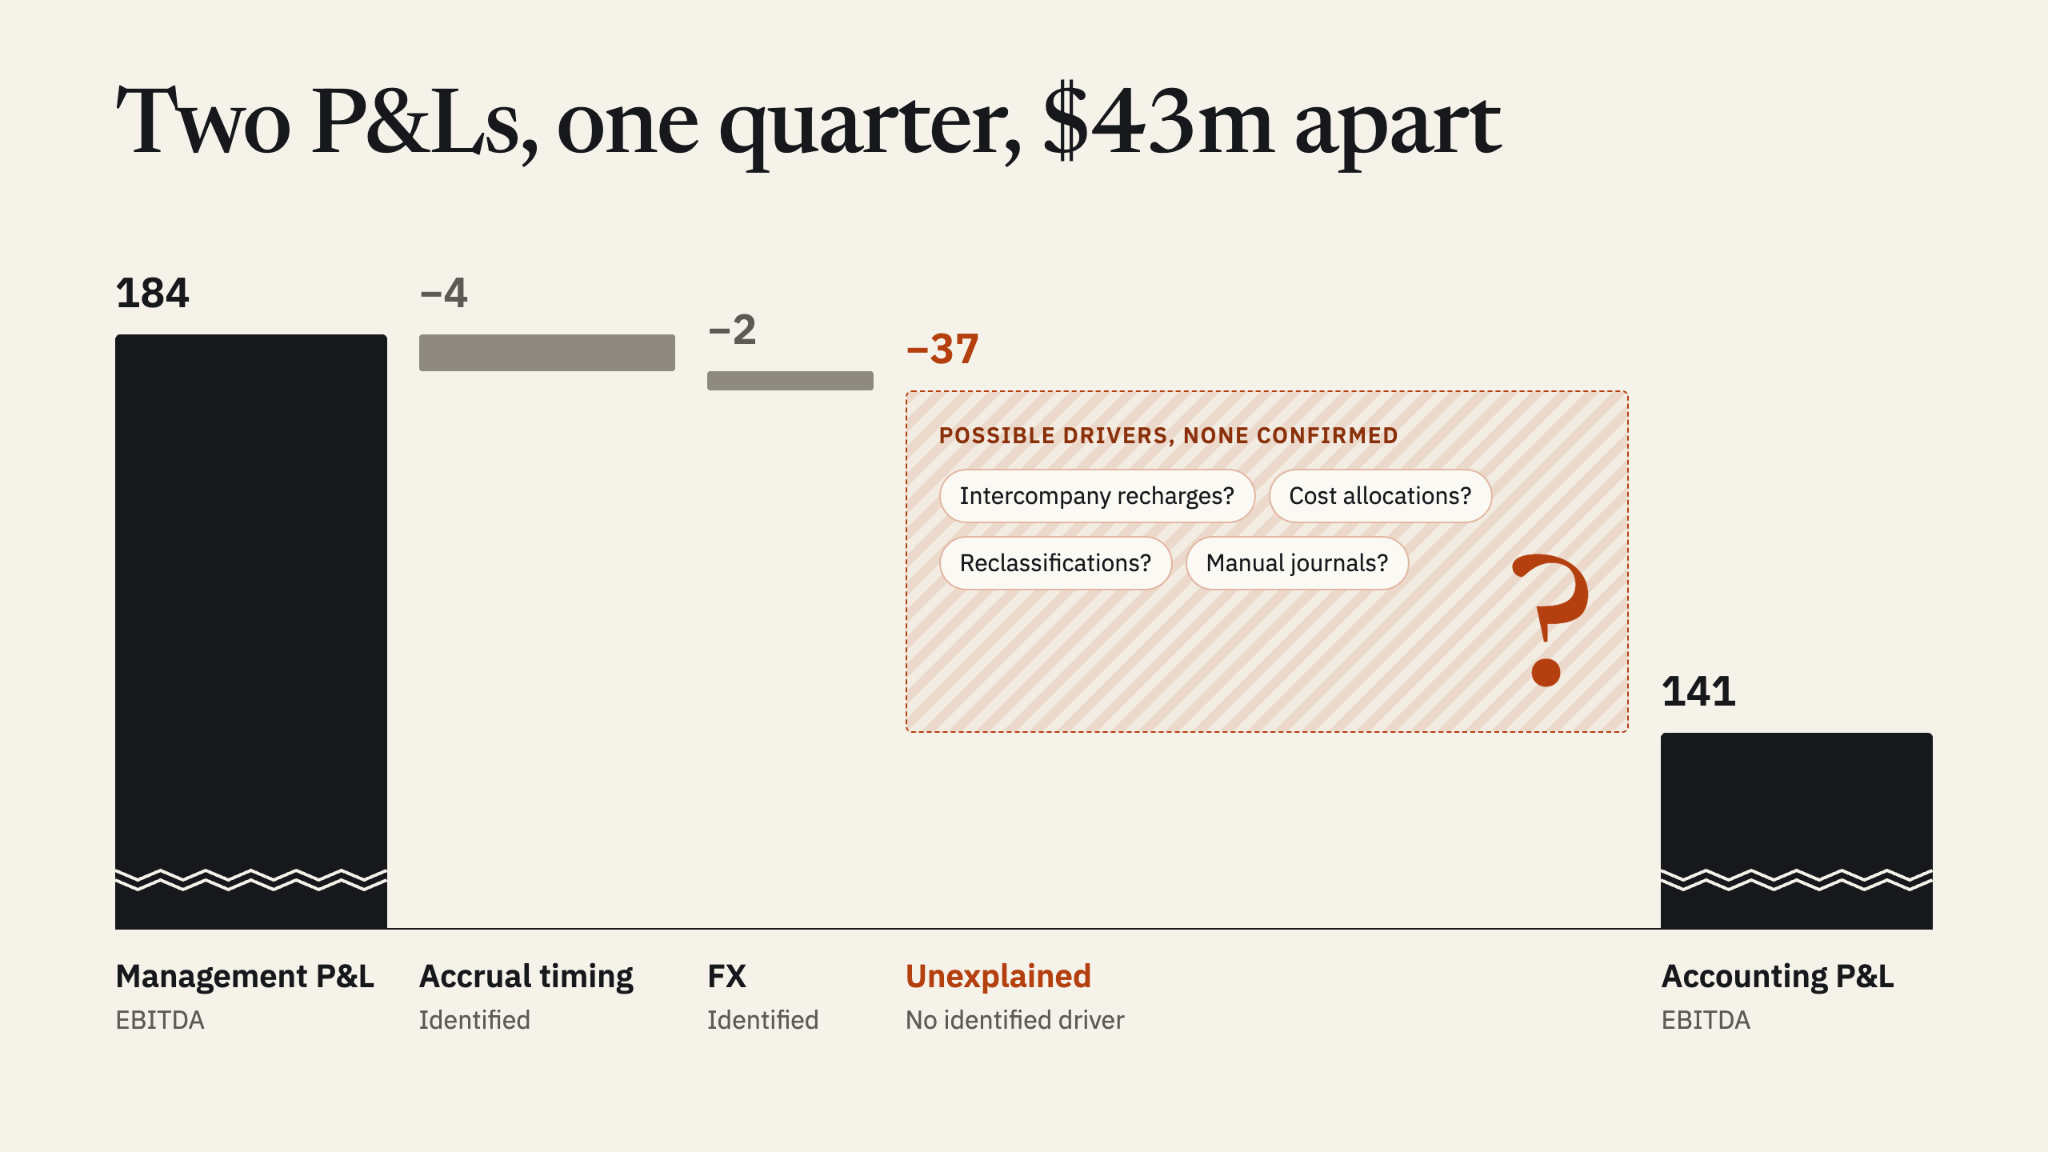
Reconciliation alone is not enough either, since spreading every cost equally across every customer could produce a total that reconciles perfectly and still be a poor basis for pricing. Finance needs to check whether the allocation reflects the activity that actually drives the cost. It also needs to explore alternatives: what happens if the supplier changes its pricing, if shared engineering work is allocated differently, or if the next customer needs more support than the average.
If every explanation or adjustment requires another technical project, finance struggles to own the foundation it depends on.
Most companies end up with a P&L that is good for reporting and one-off projects for the decisions it cannot answer
These constraints explain why so many companies stop at a high-level business P&L. That P&L does its job: it closes the books, reports results, and tells you whether the company as a whole is making money. What it cannot do is tell you about individual customers, products, or projects. Costs are spread using company-wide averages, so pricing a specific customer or evaluating a specific supplier means assuming they behave like the average. Many do not, and the P&L cannot tell you which ones.
When one of those questions becomes important enough, the company runs a separate project. An analyst pulls vendor reports, interprets charges, gathers context from colleagues, and builds a procurement analysis or customer-profitability view in Excel.
That work can be valuable, but the company gets an answer at a point in time, without necessarily establishing the inputs, rules, and ownership needed to keep it current. Because the process depends on people finding time to repeat it, it gets delayed or covers only the most important costs.
A procurement analysis from six months ago cannot reliably support today's pricing call. An AI agent running a weekly workflow faces the same constraint: it cannot complete the analysis on its own if a key input depends on someone rebuilding a spreadsheet.
Building the finance data foundation for AI therefore means turning this repeated work into maintained models, with business context that stays current and logic finance can understand, check, and adapt. That is the problem we are trying to solve at Margin.
How we think about this at Margin
margin turns your messy enterprise data into live models: customer-level P&L, cost-to-serve, and forecasts. These are the numbers behind automating finance work and your biggest pricing, growth, and operational decisions, and we have made four choices about how to produce them.
1. Gather as much context as possible from systems, so less of it has to come from people
We collect far more than the ledger. Alongside the ERP and the warehouse, we pull the operational records that explain what drove each cost and each sale, such as transactions, orders, and support tickets. We also read the contracts you hold with vendors and customers, where rates, terms, and scope are actually written down. From all of this we build a context layer describing how the business operates.
The more of that context we can take from systems, the less finance has to go and collect from procurement, operations, and regional managers.
Some judgment still has to come from a person, and we make that cheap to record once. When you set up a cost allocation in Margin, you write down every condition you can state precisely, such as which customers a vendor charge covers or which period a late invoice belongs to. Where a rule cannot be stated precisely, you give an LLM your reasoning once and it applies that judgment to every record that follows, instead of an analyst re-deriving it each month.
It will occasionally get one wrong, so Margin flags every discrepancy and every allocation that looks unusual and shows you reconciliation and allocation quality, so the mistakes are visible and easy to correct. Throughout, agents do the gathering, interpreting, and structuring, which is the part of the data work that never got staffed.
2. Finance builds the models itself and keeps them current as the business changes
Once the data is in, finance turns its understanding of the business directly into cost allocations, revenue forecasts, and lifetime value models. You describe the logic you want, build and iterate on the model, inspect its assumptions, and change the methodology when it does not match how the business works, with the speed of vibe coding but with logic that stays visible. Two kinds of checks keep that honest.
Every model reconciles its recorded costs and revenue to the general ledger, with forecasts showing how they build on those actuals, so you can tell an expected difference from an error. We also test the allocation itself, because a model that spreads every cost equally across every customer can reconcile perfectly and still be useless for pricing. That test checks whether each allocation reflects the activity that drives the cost.
Models are deployed through Git with version history, permissions, and approval controls, so finance can inspect and extend the logic while the company keeps a controlled set of models to work from.
The same setup keeps the foundation in step with the business. Because we pull data from the procurement system, the warehouse, and the finance systems and reconcile it continuously, a new vendor, a new revenue stream, or a charge that no longer matches the rules shows up as a discrepancy as soon as it appears. Fixing it means editing a model finance already understands rather than opening another technical project. When a new question comes up, you extend a model instead of starting another one-off.
3. Analysis in everyone's hands, traced to source
With the foundation in place, anyone in the business can ask the questions finance is normally asked: which customers are still profitable after cost-to-serve, how the next product should be priced, which supplier decision is hurting the margin. Margin answers from the models and shows the trail behind every number, from the answer to the model and its assumptions and on to the underlying costs, activity, and source records.
Finance can change the relevant assumptions when the decision calls for a different scenario. Plenty of tools promise this kind of analysis, but what decides whether the answers are any good is the data underneath, and that is where around 80% of our work goes.
4. Finance work that runs itself
The same foundation runs the work finance repeats every cycle: Margin executes weekly reporting, variance analysis, and routine checks on schedule, investigates what moved, and sends only the findings that need attention to your inbox. An agent can complete this on its own because no input depends on someone rebuilding a spreadsheet. The automation is the visible part, but the number one blocker to making it work is the data it runs on.
Getting that clean and keeping it clean is the heavy lifting behind everything above.
Where to start
You do not need a data team or a new system to take the first step. Pick the two or three decisions where being wrong costs you the most, whether that is pricing a large contract, deciding where next quarter's growth budget goes, or choosing a supplier. For each one, write down what you would need to know, at what grain, and by when that information could still change the outcome. Then check whether your current P&L can actually answer it.
In most companies it cannot, and the gap between the two is the specification for your finance data foundation.
If you would like a second pair of eyes on that exercise, I am happy to work through it with you: which decisions are worth supporting, the grain and timing they require, and the data and models it would take to get there. And if it makes sense for your business, I can show you how Margin does the heavy lifting, from collecting and cleaning the data, to giving finance models it can understand and change, to running the recurring analysis on top. Feel free to reach out!
Originally published on LinkedIn on September 23, 2026.